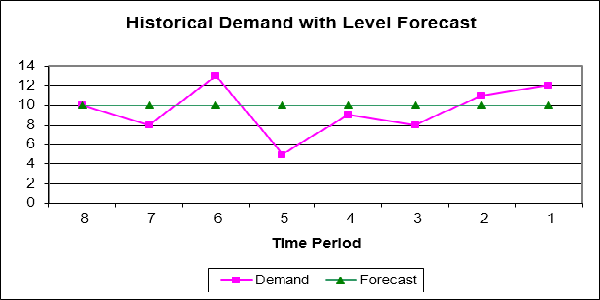
Supply Chain Forecast Accuracy is usually measured with Mean Absolute Percent Error or MAPE, the average of percentage errors. But there are several other metrics to consider. Here’s an example …

n = 8 periods
|x| = absolute unsigned value
^2 = squared
Average Error (AE) = (sum (Et))/n = -4/8 = -0.50
Mean Absolute Deviation (MAD) = (sum |Et|)/n = 16/8 = 2.00
Mean Square Error (MSE) = (sum (Et*Et))/n = 48/8 = 6.00
Standard Deviation (SD) = square root((sum(Et*Et))/(n-1)) = sqrt(48/7) = 2.62
Mean Absolute Percent Error (MAPE) = (sum(|Et|/Dt)*100 = 210/8 = 26.25%
Cumulative Forecast Error = sum Et = 16
Cumulative Forecast Error Ratio = (sum |Et|)/(average Ft)
Group Forecast Accuracy = aggregate forecast vs actual