Starboard Navigator is a reasonably priced cloud-based application for designing and optimizing supply chain logistic networks. Creating products, customers, facilities, lanes is quick and easy either from the GUI or via spreadsheet upload. Under the covers Navigator uses built-in freight, labor, and lease rate tables. This makes modeling significantly easier than with Excel and faster than gathering 3rd party Origin/Destination rate quotes. Ditto labor and warehouse lease rates.
Purpose of the modeling described here was primarily to test drive the tool. But some interesting things where discovered when the solvers were used.
The following model and scenarios were intended to help decide where a new production facility should be built to help minimize freight costs. The model only considers outbound freight and does not include effects of inbound raw material freight, facility lease and labor costs. These can easily be added. The initial assumption that these factors are not significant could be wrong. Also have not included any demand from neighboring states of NV, AZ, southern OR, since expected demand was thought to be less than 10% of total region.
Initial paper modeling and spreadsheet analysis was limited to 10 customer clusters and 5 potential plant locations due to the time-consuming limitations of manually collecting Full Truck Load (FTL) and Less Than Truck Load (LTL) freight quotes for each origin/destination (lane). Starboard Navigator has freight rates built in.

Baseline
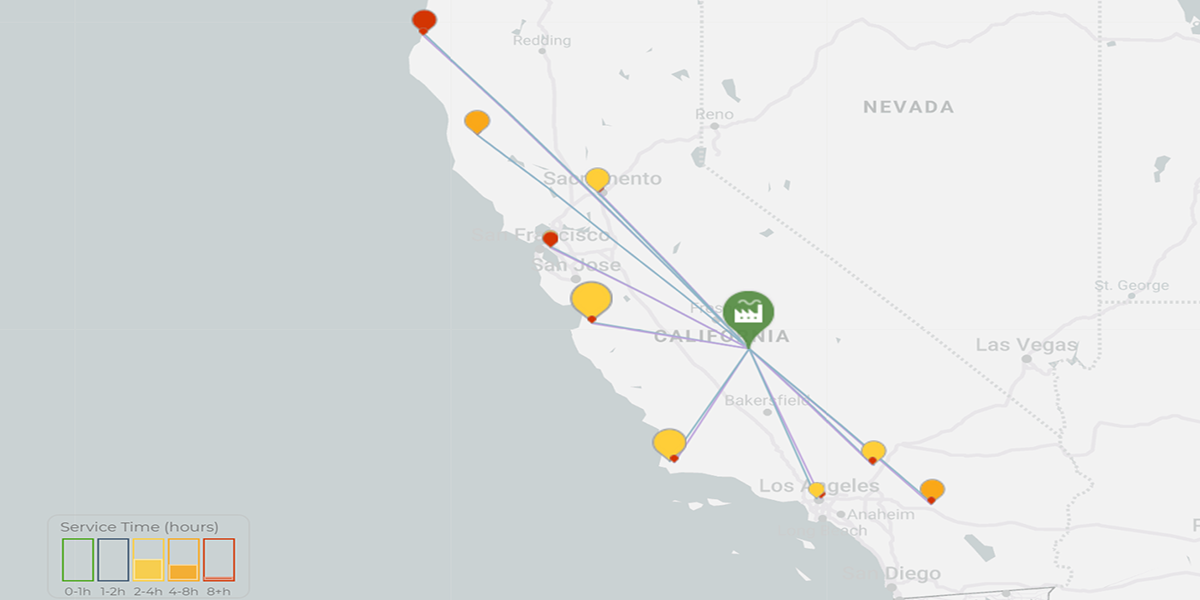
… Visalia CA, single supply point, mix of FTL & LTL freight. This was the initial tribal knowledge ‘expected’ best location. 18 ‘customers’ because FTL & LTL are separate lanes. Also note the service hour key in the bottom left and the total network cost in the top left.
FTL Only (Visalia)
… note the significant cost difference of over $500k for LTL freight. Changing customer order policies could have a very large impact. Put another way, here’s what offering less-than-truckload orders costs. A significant cost of operation for a business with delivered pricing policy. Once the model was set up it took only minutes to determine the LTL penalty.

Best Plant Locations
… with a mix of FTL & LTL, and no satellite DC or Mix Pack operations. Note the network cost savings of $50k per year over the initial baseline location.
|
Best Plant Location – Sacramento |
Bakersfield |
|
Fresno |
Merced |
Best Service
… Merced has the shortest average distribution lead time to the greatest number of customers. The green icons are the potential plant locations considered. Adding others is a simple as dropping a pin and running the solver.
Hub and DC
Adding forward stocking locations may make sense for LTL orders to reduce total network freight costs and improve customer delivery lead time. In this model, in norther California, Redding serves Eureka LTL, while FTL go direct from the plant. Same with a Stockton DC and Oakland, Willits, and Sacramento. Some savings over baseline, but facility costs are not included, and possibly prohibitive. Starboard Navigator can include lease and public warehousing costs.
Various dashboards.
Import/Export Data Tables and Reports
 |
 |
Conclusions
- Starboard Navigator is easy to configure and use.
- Attractive price compared to almost all other packages.

- Limitations …
- Freight, facility lease, and labor rates are ‘hidden’ behind the scenes. This make the tool less complicate for the user, but not easy to validate.
- Navigation is somewhat awkward – list scrolling
- Data maintenance is limited in the application and requires exporting to Excel and re-import
- Analyzing impact of product mix changes would be difficult
- Tool does not handle optimizing inventory levels, and isn’t intended to model financial impact on P&L, Balance Sheet, Cash Flow Forecasts, or provide NPV analysis
- BOM’s aren’t available (for when a plant supplies a sub assembly to another plant) – work around is cumbersome
- Capacity is fixed, not variable or multi period
- Delights …
- Adding facilities graphically on the map in seconds
- Dragging facilities around the map and having network costs dynamically recalculated almost instantaneously


